Key words: indicators, condition, urban area
The identification of specific indicators of
sustainable local areas development in the region, at first glance, seems to be
a minor problem. It is quite clear that each region has its own, the more «acute»
problems specific to this area and caused by a number of historical, resource,
geographic and etc. preconditions.
However, speaking about the specific terms of sustainable
development, it should be noted that their determination should be not an
accidental, but grounded, and issues, monitoring by this indicators must accord
to the general principles and criteria of sustainable development concept [2].
Thus, the following principles for building a system
of specific indicators of sustainable development can be marked:
- complexity, i.e. ability to reflect environmental, social and economic development
aspects;
- coherence, i.e. accounting of sustainable development trends of region in
dynamics and comparing with the russian average
values;
- hierarchy, i.e. the need of step by step indicators selection for
inclusion in the group of «specific», which includes the selection of indicators with negative
dynamics in the first stage, as well as the selection of indicators with values
worse than the russian averages in the second stage,
and bolting out the «unnecessary» or extension of figures in the third stage by analyzing
causes and preconditions of shaping problem with the applying of expert
methods;
- accessibility, i.e. monitoring by the
system of Russian statistics.
To determine the most acute issues of sustainable
urban areas development in the region, it is proposed to use the model of
«pressure-state-reaction» indicators system [1]. An important feature and
advantage of this model is the logical interconnection between the indicators
of «pressure», reflecting the level of negative human impact, indicators of
«state», reflecting the currently existing quality of the environment
components and the «reaction» indicators that characterize the public response
to the current pressure level.
This model allows to identify
cause-effect interconnections between economic, environmental and social
conditions that provides the basis for decision–making in the sphere of
environmental–economic policy, and also allows the public to trace
interconnection of such phenomena and to develop the arising issues solving
policy. The following specific set of indicators to assess the
sustainable development of socio-ecological-economic system can be offered
(Table 1).
The system of indicators contains a rather well-known
indicators, most of which are included in range of indicators calculated
by the Federal State Statistics Service and its regional departments:
1. «Pressure» Indicators
1.1. Emissions of
air pollutants from stationary sources and vehicles
1.2. Proportion
of trapped and neutralized pollutants in the total emission volume
1.3. Volume of
wastewater discharges to surface waters
1.4. The
pollutants mass dumping
1.5. Generation
of waste
2. «State» Indicators
2.1. API – Air
Pollution Index
2.2. SI –
Standard Index – index for the concentration of impurities in terms of maximum
allowable concentrations
2.3. HF – The
Highest Frequency of exceeding the maximum permissible concentration
2.4. Specific
weight of waste water samples that don’t meet hygienic standards
2.5. The water
quality of 2-nd category reservoirs of water use
(recreation area)
2.6. Natural
increase (loss) of the population
2.7. Climate
change (average annual temperature and precipitation, humidity, level of water
bodies)
2.8. Gross
regional product (GRP)
2.9. Human
Development Index (HDI)
3. «Reaction» Indicators
3.1. The costs of
environmental protection
3.2. Collection
of payments for negative impact on the environment
3.3. Penalties
for violation of environmental laws
3.4. Investments
in fixed capital, aimed to protect the environment
3.5. The share of
GRP accounted by environmentally clean goods and services
The first group of indicators – «pressure indicators» – includes indicators that reflect the parameters of
human impact on the basic components of the environment: air, water bodies,
land and forest fund, as well as on the fundamental properties of ecosystem:
production of bio–resources and pollution assimilation, which are considered
through the indicators of a biodiversity and waste accumulation.
The second group of
indicators – «state indicators» – contains the
basic parameters of environmental quality and its major components that are
reflected by various indicators of the pollution level. In addition,
indicators, reflecting the general prosperity of the region's population,
dependent on the quality of the environment and resources, reflecting the
general level of economic development and differentiation of society in terms
of economic development are included here.
Besides, in order
to reflect the level of environmental region economy it is advisably to use GRP
energy intensity, reflecting the general state of economy from the point of
using the energy efficient technologies in it (which are also environmentally
clean). Despite the seeming simplicity of such an indicator, its use is
necessary, as it most completely reflects the efficiency of existing regional
policy in the field of ecological economics and in fact without going into
excessive detalization by an assessment of concrete
instruments and mechanisms used for it, and reflects the final «output» result
of the system.
Human development
index (HDI), which reflects the general picture of modern society development
and the possible heritage for future generations is
also included in the second group of indicators.
The third group –
indicators of «reaction» – includes a number of indicators that characterize
different courses of the implemented in a region environmental–economic policy:
implementation of costs for environmental protection, Collection of payments
for negative impact on the environment, measures related to pollution
prevention, etc.
The choice of
concrete indicators was determined by the following conditions: the presence of
a comparable official data over a sufficiently long period of time (5–10
years), the possibility of an adequate assessment of the overall region
situation. In general, this set of indicators may be expanded at the expense of
their concrete definition in different directions depending on the realizable
goal, as well as the specifics of a particular region, by including more
detailed information on municipal entities, types and substances effects; sectoral sign, more detailed segmentation of the environment
components, regulatory institutions of the impact on environmental, etc.
For the most
trustworthy assessment effectiveness of implemented in the area
environmental–economic policy, it is needed to consider these indicators in the
long–term dynamics, that will trace the measures taken in the field of
environmental protection, and their effects, that are coming out in the
parameters of human impact on the environment and quality characteristics of
its main components.
The advantage of proposed indicators system for sustainable development
of nature–economic region system is that indicators in its structure may not
only reflect the impact of anthropogenic pressures on the region ecosystem, but
also on economic activity (through the degradation of natural resources and
environmental quality) and also allow us to estimate the level of regional
disparities (through the HDI and Gini coefficient),
to identify the largest sources of regional environmental externalities, and
also to assess the effectiveness (or ineffectiveness) of implemented in the
region management measures to reduce them.
It should also be noted that the presented set of
parameters is not fixed and rigidly confirmed. The basic principle which must
be observed here, is the possibility to trace the most
common indicators at the regional level and the effects exerted by the impact
of decisions on the parameters of the environment and its major components. The
condition of region ecosystem in the indicators system is reflected very
detailed. The remaining components of regional systems (economic and social),
are less reflected, but it is impossible to diagnose the problems of
sustainable region development without analyzing them.
As
a threshold value may be the target parameters of indicators, which is planned
to reach in process of management of the region development (russian average, world average,
MPC/MPN, the average for developed countries and etc). For some indicators
rigid standards may absent, then as such kind of
standard can be taken the best or average country values.
In order to determine «specific» indicators on the basis of the proposed
system of indicators for sustainable environmental–economic region system
development that reflect the most acute problems, it is proposed to use the
following approach to the formation of problem field of sustainable development
and selection the most problematic, requiring special attention indicators
(fig. 1).
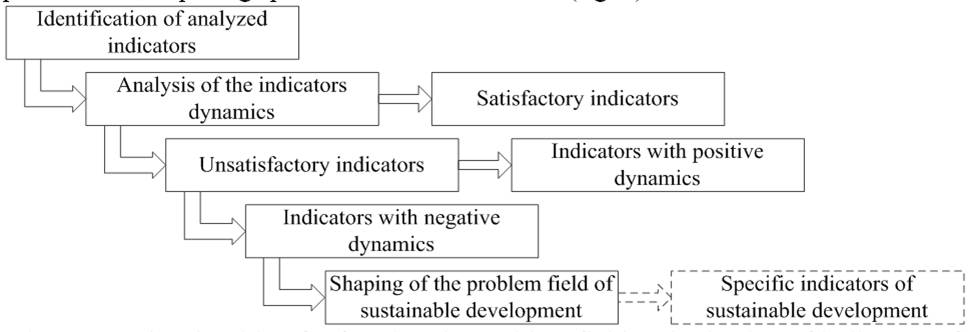
Figure
1 – The algorithm for forming the problem field and selection of indicators of
sustainable region development
In
general, current situation [3] demonstrates the low efficiency of overall
stimulation system to reduce negative impact on environment. As
the regional bodies of power, the economic entities and population are also
consider the need to take into account environmental factors in the organization
of economic activity as extremely costly measure that doesn’t conduct the
improving of their economic efficiency. At the same time, world
community has already developed approaches, which allow to
provide the double effect from ecologization:
both economic and environmental.
1. Indicators of Sustainable
Development, UN Department for Policy Coordination and Sustainable Development,
December, 1994.
2. Anopchenko T.U., Murzin
A.D. The structure of socio-economic and environmental
components of an integrated area development // Science and Education Journal.
– 2012. – №1. – P. 22 – 29.
3. Murzin A.D. Comprehensive assessment of
urbanized areas: economic, ecological and social aspects: monograph. - Saarbrucken:
LAP LAMBERT Academic Publishing, 2012. – 80 p.