The analysis of the electric energy prices in Polish Power Exchange
włodarczyk a., zawada Ām. (WZ PCz, c. Częstochowa, Poland)
The following study focuses on the analysis of the electric energy prices and their returns in Polish Power Exchange in the last year. The analyzed time series were verified as regards the existence of the autocorrelation, which indicates at periodic behavior of electric energy prices. The presented results of the quantity analysis let us compare how frequencies of the data influence the levels of electric energy prices in Polish Power Exchange.
└ĒÓļĶń ÷ÕĒ ĒÓ ’Ņļ³±ĻŅņ ¹ĒĻÕ ²ļÕĻ“Ņ²ĒÕŃĶĶ.
1. Introduction
Such features of the stock exchange as: standardization of contracts, diversity of market participants, their anonymity, open offers (as far as the amount and price are concerned), market liquidity, the presence of a clearing bank, which guarantees that parties of a contract fulfill their obligations, year by year cause the increase in the number of goods that are a basic instrument of stock exchange turnover, and increase the turnover volume.
Forming electric energy stock exchanges was mainly connected to the processes of reorganization and liberalization of electric energy markets. At first they appeared in the structure of the energy market in Scandinavia (Nord Pool), the Netherlands (Amsterdam Power Exchange), Spain (Spanish Power Exchange), German (European Power Exchange).
In Poland the creation of Giełda Energii S.A. was initiated by the announcement of the Minister of the Treasury in July 1999 of a tender for a consortium which would create and open energy stock exchange in Poland. The winner of the tender, adjudicated at the end of September and the beginning of October 1999, was the consortium led by ELEKTRIM S.A. The founding act of Giełda Energii S.A. was signed by shareholders/founder members on 29.11.1999. First commercial transactions were concluded on 30 June 2000.
The most important thing in functioning of each stock exchange is determination of price and volume of turnover. Generally there are two kinds of stock exchange quotations. The first one is a system based on a uniform quotation. It consists in collecting offers of purchase and sale until a given hour, and then comparing them using a classic demand and supply graph. The intersection of curves determines current price and turnover in a given trading session. The second one is a system based on continuous quotations. An offer to purchase or sale appears at any time during a day and is completed at the moment of finding a counter-offer. In this way price is determined individually and it changes several times during a day. In Poland (and not only in Poland) electric energy stock exchanges as a rule function on the basis of a uniform quotation.
The existence of energy stock exchanges ensures adequate price structure and investments signals for potential investors in the power industry. It is due to the fact that stock exchange is a very sensitive market barometer. If on some days, and even at some hours, lack of energy appears, prices on stock exchanges rise dynamically. Obviously at the same time actions are taken up on financial markets for hedging open items on energy stock exchanges against market risk. Therefore, in large measure, subjects and consumers do not feel it. However, from the point of view of potential investors it is a very important signal, especially as for the development of various peak sources, building high adjustment gas power plants etc. These investments are justified by the spread between energy prices during and beyond peak hours. Quantitative analyses provide information on regularities in price formation and volatility, which depict moods of market participants.
2. Methodology ¢ tests for autocorrelation in time series
The process of levels or rates of return on electric energy prices is usually investigated in terms of stochastic processes with discrete or continuous time. Growing requirements for modeling the properties of processes occurring on financial markets, especially including electric energy markets, have led to recording examined phenomena in shorter and shorter time intervals: every day, hour, minute etc. All analyses conducted on the basis of such data, called in econometrics high frequency of data, enable faster and more effective investment decisions.
The theory of financial markets often instead taking into account financial prices focuses on rates of return on these prices,[1] and at the same time logarithmic rates of return are most frequently used:
![]() Ā Āfor t = 2, ...,
nĀĀĀĀĀĀĀĀĀ (1)
Ā Āfor t = 2, ...,
nĀĀĀĀĀĀĀĀĀ (1)
where:Ā rt ¢ rate of return in t period, Pt ¢ price of a financial instrument in t period, Pt-1 ¢ price of a financial instrument in t-1 period.
In the literature on the subject aiming at detecting and describing statistical properties of prices of financial instruments a lot of space is taken up by such issues as: nonstationarity and heteroskedasticity of price series, leptokurtosis, asymmetry and ōthick tailsö of their distributions. Over a longer period of time, exchange return rates are characterized by the following properties (discussed in Jajuga (2000)):
1) Occurrence of the volatility clustering phenomenon ¢ both large and small changes of prices occur in series. After a large volatility period, there occurs a period of smaller volatility. This dependence is also known under the name of data concentration effect. In the case of long time series and data of high observation frequency it usually results in an increased random factor variance in appropriate classic models.
2) Prices returns distributions are leptokurtic. The probability of occurrence of untypical (very large or very small) price fluctuations is higher than in the case of normal distribution. In the literature, another term for this phenomenon is also used, i.e. occurrence of ōthick tailsö in the rates of return of prices distribution.
3) These distributions are in many cases skew, which means that the rate of return distribution is not symmetrical around the average.
4) Price fluctuations are negatively correlated with the changeability of their variance. Process variance depends on the previous rates of return, so when the price drops, there is a tendency towards an increase in the rates of return. This dependence is known as the leverage effect.
5) There is a relationship between the variance of the returns and autocorrelation. The autocorrelation usually accompanies a small price variance and large volatility results in the lack of autocorrelation.
6) Long-run data dependence, which means that after significant increases there are further increases, after which sudden decreases occur, followed by further decreases.
Authors consider the existence of autocorrelation in time series of the electric energy prices, which differs from one another the frequencies of the date. There is an important relation between variance of rates of return and their autocorrelation. Autocorrelation is usually connected to low variance of returns on a financial investment, whereas high volatility causes lack of autocorrelation. The significant autocorrelation in these time series point out the periodical behavior of the electric energy prices. The Autocorrelation Function (ACF) may be useful to detect the phenomenon of autocorrelation in the time series, which assigns appropriate value of autocorrelation coefficient to a given lag. To verify the significance of individual autocorrelation coefficients, one may use a test whose test statistics is described in the following formula:
 ĀĀĀĀĀĀĀĀĀĀĀĀĀĀĀĀĀĀĀĀĀĀ (2)
where: ![]() Ā- autocorrelation order,
Ā- autocorrelation order, ![]() Ā- autocorrelation coefficient.
Ā- autocorrelation coefficient.
One also may jointly examine the importance of determined autocorrelation coefficients using the Ljung-Box test, whose test statistics is described in the following relation:
![]() ĀĀĀĀĀĀĀĀĀĀĀĀĀĀĀĀĀĀĀĀĀĀ (3)
ĀĀĀĀĀĀĀĀĀĀĀĀĀĀĀĀĀĀĀĀĀĀ (3)
One may also use the Partial Autocorrelation Function (PACF), which returns the coefficient of partial autocorrelation (free of the influence of all lesser lags) to a given lag.
3. Empirical research
This study contains the analysis of information concerning electric energy prices on the Next Day Market from an hourly and a daily perspective in 2005 on Polish energy stock exchanges. Figures 1 and 2 offer a first look at the data by showing the original price series and corresponding logarithmic returns.
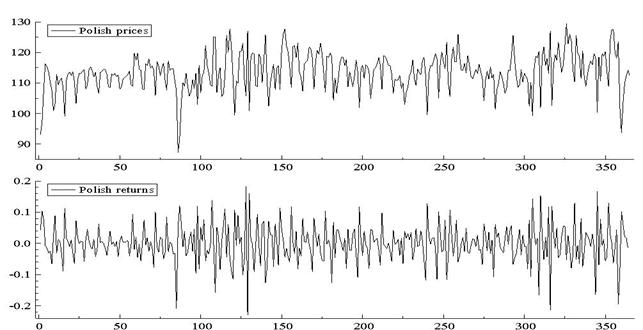
Figure 1- Daily observations on the level (top panel) and returns (bottom panel) of Polish electric energy prices, from 1 January 2005 until 31 December 2005

Figure 2- Hourly observations on the level (top panel) and returns (bottom panel) of Polish electric energy prices, from 1 January 2005 until 31 December 2005
Autocorrelation and partial autocorrelation coefficients of the order of 14 (daily data) and 168 (hourly data) have been determined for levels and rates of return on electric energy prices because of periodic fluctuations with a daily and an weekly fluctuation cycle characteristic for this phenomenon.
Model graphs of autocorrelation function and partial autocorrelation for levels and returns on electricity prices are showed below:
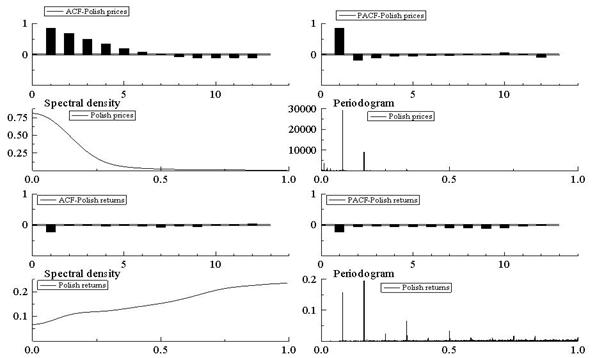
Figure 3- Sample autocorrelation (ACF) and partial autocorrelation (PACF) functions, spectral density plot, periodogram of Polish energy prices (upper panels) and returns (lower panels)
The values of determined autocorrelation coefficients for energy prices considerably exceed the values of autocorrelation coefficients for returns (compare table 1, 2):
Table 1- Test statistics for autocorrelation coefficients for daily energy prices and returns
|
Energy Exchange |
I(1) |
I(7) |
L-B(14) |
|
Polish -Ā prices (ACF) |
8,11083 |
8,3900 |
192,61 |
|
Polish -Ā prices (PACF) |
8,11083 |
7,7775 |
- |
|
Polish ¢ returns (ACF) |
5,7947 |
8,5988 |
170,96 |
|
Polish¢ returns (PACF) |
5,7947 |
2,1764 |
- |
Source: Own calculations.
Table 2- Test statistics for autocorrelation coefficients for hourly energy prices and returns
|
Energy Exchange |
I(1) |
I(24) |
I(168) |
L-B(168) |
|
Polish -Ā prices (ACF) |
152,5151 |
81,1635 |
88,8313 |
121235,00 |
|
Polish -Ā prices (PACF) |
152,5151 |
3,1217 |
17,0655 |
- |
|
Polish ¢ returns (ACF) |
21,4231 |
49,1341 |
19,0137 |
5046,46 |
|
Polish¢ returns (PACF) |
21,4231 |
9,1968 |
1,5394 |
- |
Source: Own calculations.
On the basis of determined test statistics it may be concluded that there is autocorrelation of the order of 1, 7, 24, 168 in most series of energy prices on the importance level of 0,001. However, the values of Ljung-Box statistics show significant higher order autocorrelation in the series of energy prices and returns.
4. Summary
Summing up the above discussion it should be emphasized that in the case of energy prices noted on Polish stock exchanges there are periodic fluctuations with a daily and an weekly fluctuation cycle. In conclusion it should be stressed that the above discussed property of time series is explained among other things by the inflow of news to energy market and their subjective interpretation on the part of individual market participants, as well as the share of bilateral contracts in the turnover of electric energy. Therefore, among other things all kinds of methods of analysis, modeling and forecasting electricity prices, especially the one purchased on energy stock exchange, have become such an important issue. Initiating a daily/hourly balancing mechanism influenced initiation of price-determining mechanisms based on demand/supply conditions. After diversifying imbalance energy prices in the balancing mechanism for consumers, the role of intra-day market in managing market risk has significantly increased.
Referneces
Bober A.: Jak praktycznie zwiększyć obrót na giełdzie?, www.cire.pl
Brockwell P.J., Davis R.A., Introduction to Time Series and Forecasting, Springer-Verlag, New York 1996.
Campbell J. Y .,Ā Lo A. W., MacKinlay A. C., The Econometrics of Financial Markets, Princeton University Press,Ā Princeton 1997.
Charemza W., Deadman D., Nowa ekonometria, PWE, Warszawa 1997.
Franses P. H., D. van Dijk, Non-linear Time Series Models in Empirical Finance, Cambridge University Press, Cambridge 2004.
Hamilton ĀJ.D., Time Series Analysis. Princeton University Press, Princeton, New Jersey 1994.
Hendry D. F., Doornik J., Empirical Econometric Modelling Using PcGive, Timberlake Consultants LTD., London 2001.
Jajuga K.Ā (red.), Metody ekonometryczne i statystyczne w analizie rynku kapitałowego, Wydawnictwo AE im Oskara Langego, Wrocław 2000.
Zerka M., Strategie na rynkach energii elektrycznej, Instytut Doskonalenia Wiedzy o Rynku Energii Sp. z o.o., Warszawa 2003.